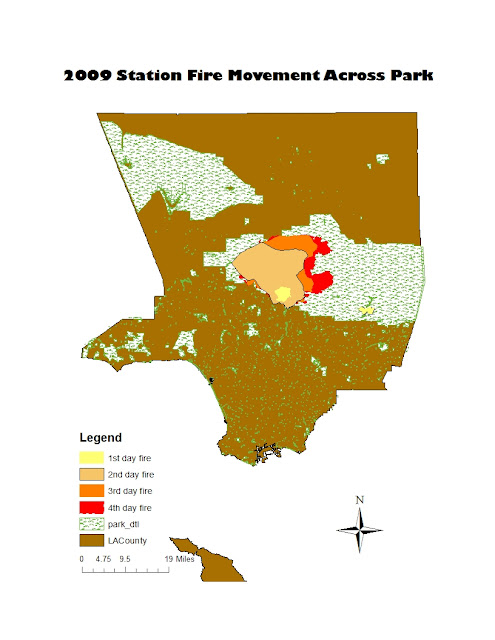
Hence, after viewing this first map we can see the way the fire is moving day after day across this large land of grass on the park. The fire also gets bigger causing more damage. There are 150 basins in th LA county and 29 are in this burn area, plus there are a combined 1,206,900 cubic yard of material burning here. (Holmes) So by looking at this map we can see that in order to protect these basins we have to see how the fire is moving. Our observation of the map also tells us that there is a lot of land burning and this is causing a huge amount of debris to form.
Now to get further insight on the future events of this fire we take a look at how the debris is falling across the land in order to see if this can cause any damages. Furthermore, we look at the map on the 3D elevation of the burning hill to see how debris falling is going to effect the steep mountains. It is said that Dunsmore Canyon is one of the steep hills affected by the debris and when rainfall comes in on the steep basins there are going to be dangerous flash floods. (Kean, Stanley) Therefore, it is important to observe the 3D elevation because we can stop the future damage of floods and mudslides.
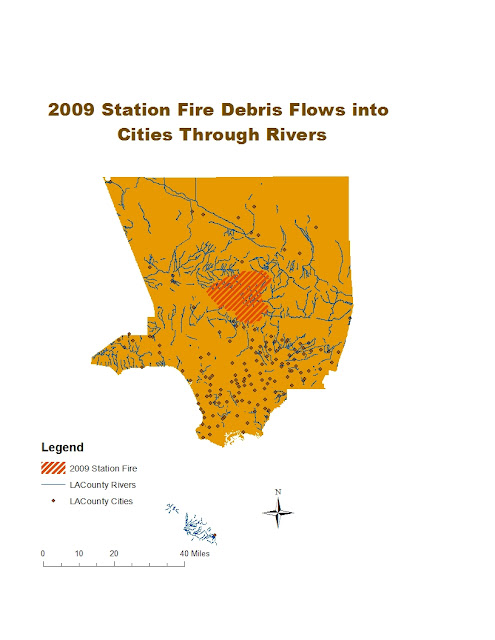
We can also compare these previous maps with this following map to see the multiple effects of the fire. By looking at all maps, we can see how the fire causes debris and how that debris falls on the land and into the rivers. The debris in this case had fallen into major basins like the ones that flow into the Pacoima Canyon or Big Tujunga Canyon. These were identified as having large volumes of debris flow, greater than 100,000 cubic meters. (Cannon, .etl) This information on the graph is important because it can come in rushing into communities that can pollute and harm our waters.
More than harming our waters, it can destroy our communities because the debris in the rivers and basins get clogged up and the mud and water then come down the mountains and crashing into the communities. Henceforth, on the map we see that the fire is very near a particular set of cities that have rivers flowing through them.
There were a total of 43 houses and 25 cars that were damaged, with 12 houses suffering major structural damage. (Petley)
Thus, ArcGIS maps come in very good handy because if we put more attention towards these observable pieces of evidence we can prevent future incidents such as those caused by the debris of the 2009 Station Fire.
Works Cited
Cannon,
Susan, Joseph Gartner, Michael Rupert, John Michael, Dennis Staley, and Bruce
Worstell. "Emergency Assessment of Postfire Debris-Flow Hazards for the
2009 Station Fire, San Gabriel Mountains, Southern California." USGS
Science for a Changing World. N.p., 13 2010. Web. 12 Dec 2012.
<http://pubs.usgs.gov/of/2009/1227/>.
Crouch, Jake.
"State of the Climate Wildfires Annual 2009."National Oceanic and
Atmospheric Administration National Climatic Data Center. N.p., 08 2010.
Web. 12 Dec 2012. <http://www.ncdc.noaa.gov/sotc/fire/2009/13>.
Holmes, Baxter.
"Storm to Test Southern California Debris Basin." Los Angeles Times. N.p., 04
2009. Web. 12 Dec 2012.
Kean,
Jason, and Dennis Staley . "2009 Station Fire, Dunsmore Canyon, Glendal
California." USGS Science for a Changing World. N.p., 27 2010. Web.
12 Dec 2012. <http://landslides.usgs.gov/monitoring/dunsmore/>.
Petley
, Dave. "Mudslides Occur in the Areas Affected by the 2009 Station Fire in
Los Angeles." The LandSlide Blog. American Geophysical Union, 01
2010. Web. Web. 12 Dec. 2012. <http://blogs.agu.org/landslideblog/>.


No comments:
Post a Comment